Roambi Analytics 7.4.5
Roambi Analytics makes it possible not only to create, edit and update data on the go, it also offers some collaboration features and pertinent graphics for use in a professional environment.
Executive reports and dashboards
Featuring a state-of-the-art interface, Roambi Analytics reinvents the way you interact with data from a mobile perspective, and even lets you share and present that data to the people you’re collaborating with.
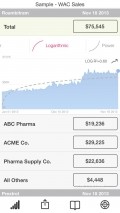
You can take any chunk of information and turn it into interactive charts and visualizations that have been specifically designed for mobile viewing. The charts appear as objects that you can interact with. For example, you can move around a pie chart like it’s the wheel of fortune.
It’s an incredibly versatile tool that lets you visualize any form of data in any way you find it suitable.
Integration with Box, BI Systems, Salesforce.com
Roambi Analytics can be set up to fetch data from including Box, BI systems, spreadsheets, databases, Salesforce.com, as well as other locations, to turn it into interactive data.
The tabs at the bottom serve with almost the same functions in any document you may find yourself, but sometimes change in accordance with the characteristics of the data.
That’s not to say it requires an Internet connection at all times. Once you’ve got your content loaded up in Roambi, you can interact with the data offline without any restrictions.
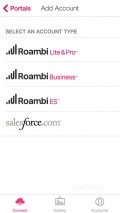
Business, Lite & Pro, ES accounts
There are various types of subscriptions that go with Roambi Analytics. Basically you have to be a customer for the mobile app to make sense. These don’t require a lot of explaining. Either you’re in the business, or you’re not.
Add to watchlist:
OfficeDocument editorData analysisHits & Misses
hits
|
misses
|
Bottom Line
Design / UI10
The visuals in Roambi Analytics are breathtaking. It’s exactly what you want from a data analysis app. |
Function9
Covers all bases, works winders for any sales-oriented business. |
Security6
For an app that’s destined to hold so much vital sales info and analytics, it’s bound to have a padlock. Yet it doesn’t. |
Battery8
Normal consumption levels. |
Price10
Regardless of the account type you choose, the app itself is 100% free to download and use. |
Compatibility9
Requires iOS 7.0 and has an iPad version to die for. |
Interactive charts and dashboards have never been more fun.
Specifications
- price:
- 100% Free
- current version:
- 7.4.5
- reviewed version:
- 7.4.2
- developer:
- MeLLmo Inc.
- category:
- PRODUCTIVITY
- os version req.:
- 7.0
- age rating:
- 4+
- in-app purchases:
- No
- hits:
- 718


